A medical practice can collect thousands of dollars every week and still have a billing problem.
Why?
Because cash in the bank only tells you what was collected. It does not tell you what was missed, delayed, denied, underpaid, or written off.
That is where KPI metrics for medical billing become useful.
The right medical billing KPIs help you answer practical questions:
- Are claims leaving the practice correctly?
- How quickly are payers paying?
- How much collectible revenue is actually being collected?
- Which denials are preventable?
- Is old A/R quietly growing?
- How much work does it take to collect each dollar?
The goal is not to put 30 numbers on a dashboard. It is to track a smaller group of metrics that show where revenue is leaking and what your team should do about it.
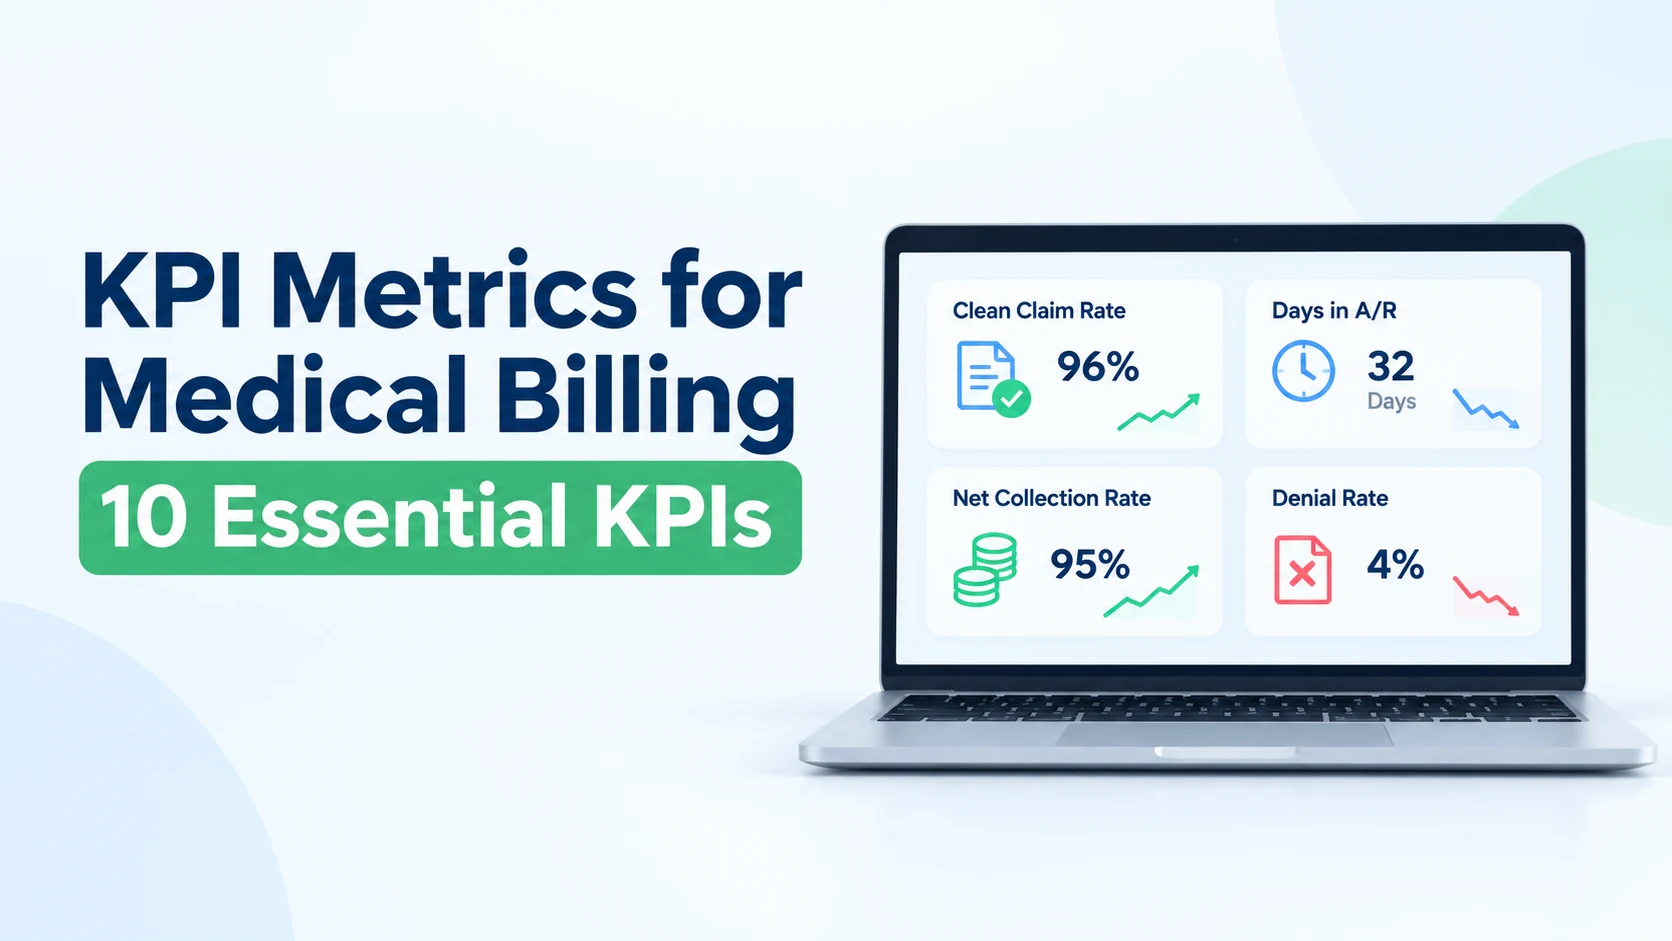
Here are 10 KPIs worth watching.
1. Net Collection Rate
If a practice tracks only one financial billing KPI, the net collection rate (NCR) deserves serious attention.
It measures how much of the money you were actually entitled to collect was collected.
Formula:
Net Collection Rate = Payments ÷ (Charges − Contractual Adjustments) × 100
For example, suppose a practice charges $150,000. Based on payer contracts, $40,000 must be adjusted off. That leaves $110,000 collectible.
If the practice collects $105,600:
$105,600 ÷ $110,000 × 100 = 96% NCR
That missing 4% deserves investigation.
The important question is not simply, “Is our NCR 96%?”
Ask:
Where is the other 4% going?
It could be denials, missed follow-up, underpayments, patient balances, filing-limit write-offs, or inappropriate adjustments.
MGMA has cited a minimum net collection rate of about 95%, with 97% to 99% described as optimal in its physician-practice RCM guidance.
However, compare your practice against its own payer mix, specialty, and historical performance instead of treating one benchmark as universal.
2. Days in Accounts Receivable
Days in A/R estimates how long it takes your practice to convert receivables into revenue.
A simple practice-level calculation is:
Days in A/R = Total A/R ÷ Average Daily Charges
Suppose your outstanding A/R is $480,000 and average daily charges are $12,000.
$480,000 ÷ $12,000 = 40 days
That number becomes much more useful when tracked over time.
A practice moving from 34 days to 47 days has a warning signal even if monthly collections still look normal.
The next step is to find the reason.
Look at:
- claims waiting to be submitted
- authorization issues
- coding delays
- payer-specific delays
- unresolved denials
- unworked patient balances
MGMA guidance has referenced roughly 30 to 40 days as an optimal range, while the AMA has encouraged practices to work toward collecting within about 30 days.
3. A/R Over 90 Days
Average A/R days can hide an expensive problem.
Imagine two practices both have 38 days in A/R.
Practice A has very little debt older than 90 days.
Practice B has a large group of claims sitting at 120, 150, or even 180 days.
Their average may look similar, but Practice B carries much greater collection risk.
Calculate:
A/R Over 90 Days % = A/R older than 90 days ÷ Total A/R × 100
MGMA physician-practice guidance identifies less than 10% of A/R over 90 days as a useful benchmark.
Do not review this number only in total. Break old A/R down by payer, denial reason, provider, location, and patient responsibility.
That is where the real problem often becomes visible.
4. Clean Claim Rate
A clean claim is a claim that can move through the billing process without requiring manual correction.
HFMA defines its clean claim KPI around claims that pass claim-processing edits without manual intervention.
A common calculation is:
Clean Claim Rate = Clean Claims ÷ Total Claims Processed × 100
If 970 of 1,000 claims pass the billing edits cleanly, the clean claim rate is 97%.
A falling clean claim rate often points to problems before the claim ever reaches adjudication:
- missing patient information
- eligibility errors
- incorrect modifiers
- invalid codes
- missing authorization data
- incomplete provider information
A high clean claim rate matters, but it should never be viewed alone.
A claim can be technically “clean” and still be denied later because of medical necessity, authorization, coverage, or payer-specific rules.
5. First-Pass Resolution Rate
This KPI goes one step further than clean claim rate.
First-pass resolution rate measures how many claims are successfully resolved without requiring rework.
That distinction matters.
A claim may leave your billing system without an edit and still require correction after the payer processes it.
A basic formula is:
First-Pass Resolution Rate = Claims resolved on first submission ÷ Total claims submitted × 100
The AMA has cited 95% as a target for first-pass resolution in private-practice revenue cycle management.
If this number falls, do not simply tell the billing team to “work harder.”
Identify which claims failed first-pass resolution and group them by root cause.
Ten repeated eligibility denials are more useful to investigate than ten unrelated denial codes.
6. Initial Denial Rate
Denial rate tells you how often submitted claims reach the payer but fail to receive the expected adjudication.
HFMA calculates remittance denial rate using denied claims divided by total claims remitted.
For a practice-level dashboard:
Denial Rate = Denied Claims ÷ Total Claims Adjudicated × 100
For example:
1,000 claims adjudicated
80 claims denied
80 ÷ 1,000 × 100 = 8% denial rate
But the percentage alone is not enough.
Your dashboard should show the top denial reasons by both claim count and dollars at risk.
A denial category involving 40 claims worth $40 each may deserve less immediate attention than eight denied procedures worth $2,000 each.
AMA guidance recommends keeping claim denial rates below 10% and notes that approximately 2% to 3% represents exceptional performance.
7. Denial Recovery Rate
Preventing denials is important. Recovering revenue after they happen is equally important.
A practice might have a moderate denial rate but an excellent team that successfully recovers most collectible denied revenue.
Another practice may simply write balances off.
Track:
Denial Recovery Rate = Dollars recovered from denials ÷ Recoverable denied dollars × 100
For example, if $25,000 in collectible claims was denied and your team recovered $20,000:
$20,000 ÷ $25,000 × 100 = 80%
Then investigate the remaining $5,000.
Was it lost because appeals failed?
Was the filing deadline missed?
Was documentation unavailable?
Was the balance incorrectly adjusted?
That information helps turn denial management into denial prevention.
8. Charge Lag
Getting a claim correct is important. Getting it out quickly is also important.
Charge lag measures the time between the date of service and the date the charge enters the billing workflow.
HFMA uses total charge lag as a revenue-cycle indicator because delays in charge capture directly affect cash flow.
For example:
Patient seen Monday.
Charge entered Friday.
That encounter has roughly a four-day charge lag.
A practice with excellent claim accuracy can still have poor cash flow if providers or departments wait several days to close encounters.
Track charge lag by provider.
If nine providers average one day but one averages six days, you have found a specific workflow issue rather than a vague “billing problem.”
9. Underpayment Rate
Receiving payment does not automatically mean receiving the correct payment.
Suppose a payer contract allows $180 for a service.
The payer sends $145.
Your account may show “paid,” but the practice has still lost $35 unless someone identifies the variance.
Track:
Underpayment Rate = Underpaid Claims ÷ Paid Claims Reviewed × 100
You can also track total underpayment dollars identified and recovered.
This metric is especially important when a practice focuses heavily on denials. Denied claims are easy to see because payment is missing. Underpaid claims can quietly close with money still owed.
Regularly compare actual payments against contracted allowable amounts. MGMA specifically recommends payer payment auditing as part of revenue-cycle monitoring.
10. Cost to Collect
Collecting $100 is good.
Spending $30 to collect it is a different story.
Cost to collect measures the efficiency of your revenue cycle operation.
HFMA defines the KPI as:
Cost to Collect = Total Revenue Cycle Cost ÷ Patient Service Cash Collected
Revenue-cycle costs can include billing staff, collections, denial work, technology, transaction costs, coding, payment posting, eligibility work, and other related expenses.
This KPI becomes especially useful when comparing operational changes.
For example, suppose collections increase 5% after adding several employees, but revenue-cycle operating costs increase 18%.
Collections improved, but efficiency may not have.
That is why financial performance should never be judged on collections alone.
Do Not Read Medical Billing KPIs in Isolation
The most valuable insight often appears when two or three KPIs move together.
For example:
Clean claim rate falls + denial rate rises
Look at front-end registration, coding, eligibility, and claim-edit failures.
Days in A/R rises + denial rate stays stable
Investigate payer delays, charge lag, unworked accounts, patient balances, or slow follow-up.
Clean claim rate stays high + net collection rate falls
Claims may be leaving correctly, but underpayments, old A/R, write-offs, or patient collections could be reducing actual revenue.
Collections rise + cost to collect rises faster
Your practice may be collecting more money but becoming less efficient.
This is why a useful medical billing KPI dashboard should not simply show green and red percentages. It should help the practice move from:
What happened?
to:
Why did it happen?
and finally:
What should we fix next?
What Should a Practice Review Every Month?
Start with these numbers:
- Net collection rate
- Days in A/R
- A/R over 90 days
- Clean claim rate
- First-pass resolution rate
- Initial denial rate
- Denial recovery rate
- Charge lag
- Underpayment rate
- Cost to collect
Then segment the problem KPIs by payer, provider, location, specialty, denial reason, and dollar value.
HFMA itself organizes industry revenue-cycle KPIs across patient access, pre-billing, claims, account resolution, and financial management rather than relying on one isolated number.
That is the bigger lesson.
A KPI should not exist simply because your billing software can generate it.
A useful KPI should tell you where revenue is getting stuck, how much is at risk, and what your team needs to investigate next.
When practices use KPI metrics for medical billing this way, the dashboard stops being a monthly report and becomes a tool for improving the revenue cycle.